Complete Financial Overview with RT Med Solutions Dashboard
Explore the key performance indicators, analyze the patient details, and improve financial outcomes of your medical practice.

Business Intelligence Reporting
Make better financial decisions with the RT Med Solutions Dashboard.

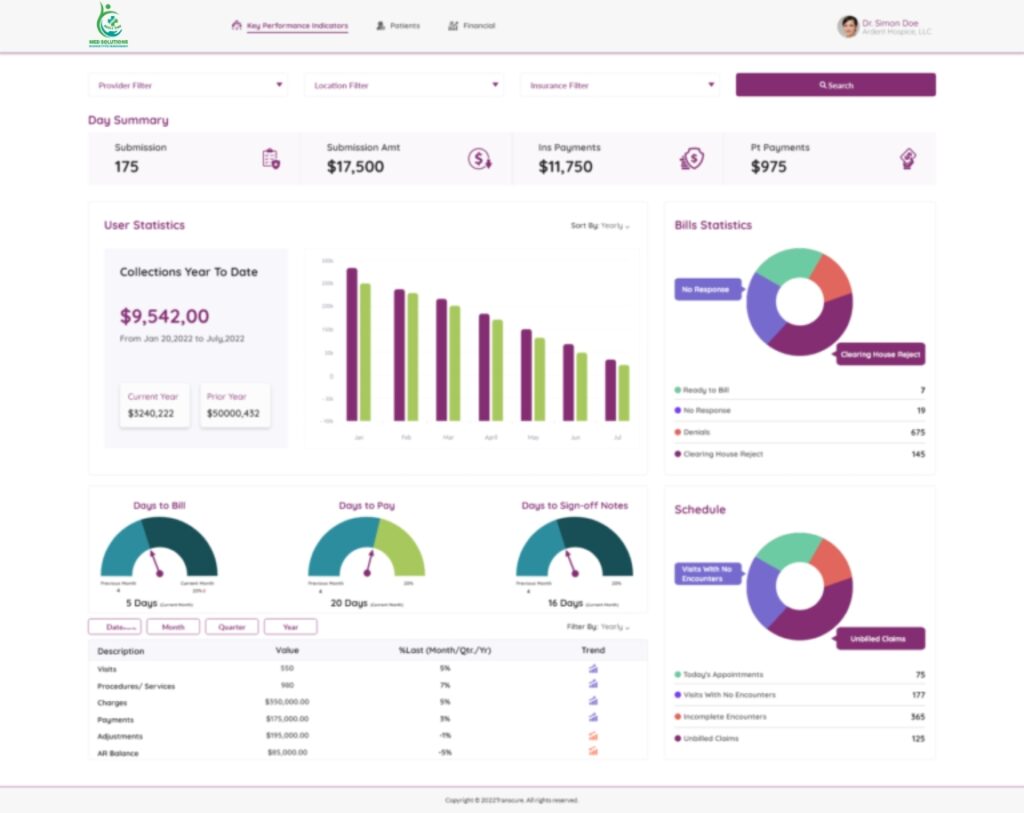
Key Performance Indicators
Submission amount, installment payments, patient payments, overall collections, and bill statistics.

Patient Dashboard
Details of the number of patients, their insurance details, new patients, appointment and diagnosis details.
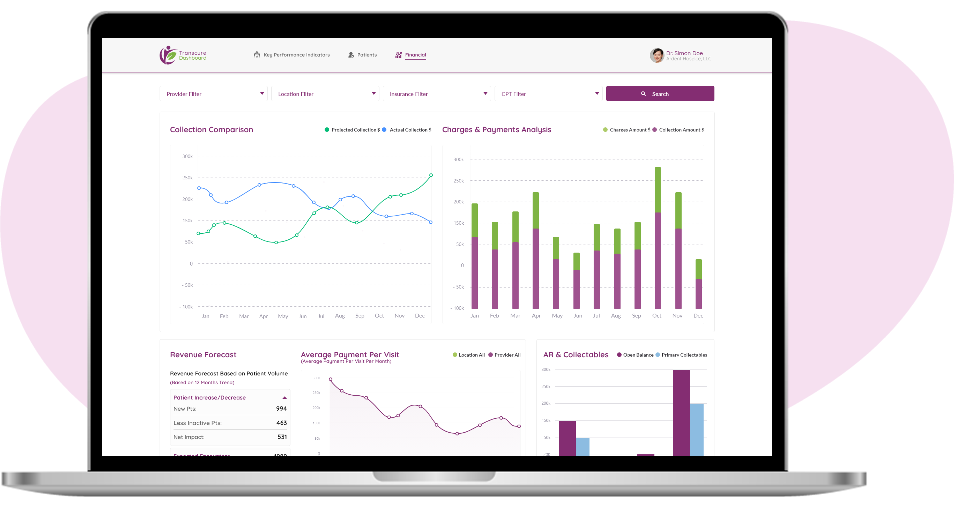
Financial Dashboard
Collection comparison, charges and payment analysis, revenue forecast, AR and collectibles, and percentage of paid claims.
Detailed Patient Analysis
The patient dashboard depicts the number of patients in your practice. Similarly, it shows active patients, new patients, and patients with no insurance. In addition, the dashboard shows the graphical view of number of patients per month. Further, the revenue generated from the patient visits with respect to targets and achievements is elaborated in the form of graphs. Moreover, appointment analysis and top ten diagnosis are also displayed in the patient dashboard.


View Practice Performance Easily
Monitor the key performance indicators which impact the revenue of your practice. In addition, analyze the overall collection from insurance companies and patients. Similarly, view charges and payments analysis and revenue forecast of your practice. Also, the graphical representation of accounts receivable and collectible allow providers to make better business decisions. Further, primary and secondary claims are segregated in the form of graphs.
